
In the 2026 ocean freight market, "changing three times a month" is no exaggeration. On the trans-Pacific trade lane alone, the U.S. routes had undergone 15 rounds of GRI (General Rate Increases) by early August. In the latest round effective August 1, Evergreen and HMM each raised rates by $3,000 per FEU, while CMA CGM, COSCO, Yang Ming, and ZIM simultaneously implemented $2,000 per FEU increases. Meanwhile, the Drewry World Container Index (WCI) reached $4,639 per 40ft container on July 9, and the Shanghai Containerized Freight Index (SCFI) surged 34.55% in a single month, rising for four consecutive weeks.
Such frequent freight rate adjustments are not simply carriers "raising prices at will." They result from a set of structural forces exerting simultaneous pressure — the normalization of geopolitical conflicts, the implementation of environmental regulations, the restructuring of alliance landscapes, and the discipline of capacity management. These four forces are intertwined, pushing global container shipping into a new cycle of high volatility and frequent adjustments.
The most fundamental variable in 2026 is that the Red Sea crisis has not subsided as the market expected. As of July, Suez Canal container ship transits were down nearly 90% compared to pre-conflict levels, with over 70% of Asia-Europe container vessels still routing via the Cape of Good Hope. The number of diverting vessels has exceeded 430 and continues to grow.
The cost of diversion is tangible: the Asia-Europe route adds approximately 3,500 to 4,000 nautical miles per single voyage, extending transit time by 10 to 14 days, with single-voyage fuel consumption rising by over 32%. Longer voyages mean vessels remain at sea longer, reducing annual operable sailings by 20% to 28% under the same fleet size. According to industry estimates, approximately 5% to 7% of global container capacity is occupied by the longer Cape of Good Hope route, equivalent to a permanent removal of 1.3 to 1.8 million TEU of effective capacity from the market.
The contraction of effective capacity directly leads to space tightness. A weekly service that previously required 6 vessels now needs 8 to maintain the same sailing frequency. Carriers have been forced to redeploy vessels from less profitable intra-Asia, Latin American, and African routes to fill Asia-Europe and trans-Pacific trunk lines, triggering a "cascading capacity squeeze" — feeder services are reduced, space tightens further, and freight rates naturally gain underlying support for increases.
In February 2026, some carriers tentatively resumed Red Sea transits, but quickly reversed the decision as security conditions deteriorated again. This means diversion has shifted from "temporary emergency" to "normalized operation," making the reshaping of capacity structure a long-term variable rather than a short-term disruption.
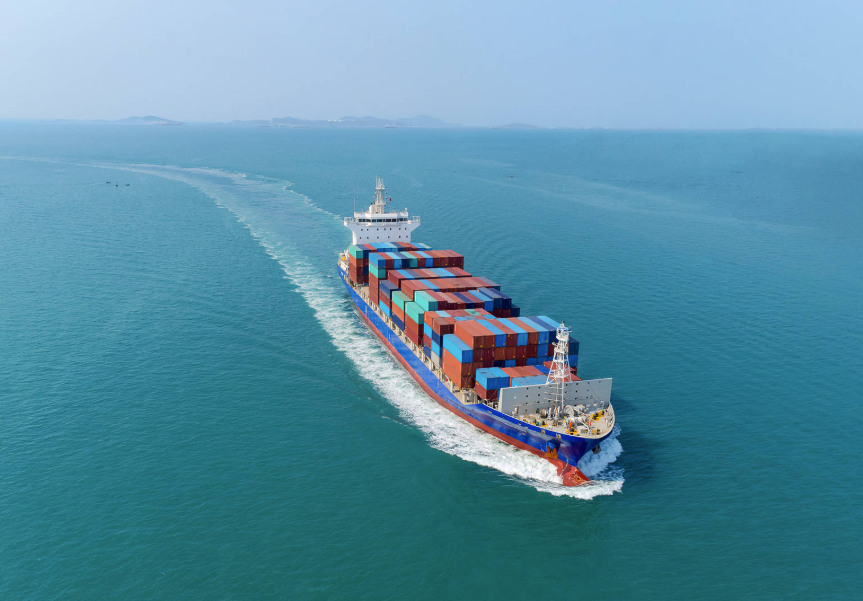
Starting January 1, 2026, the EU Emissions Trading System (EU ETS) coverage of the shipping industry officially jumped from 70% to 100% full coverage — carbon emissions generated by vessels sailing between EU ports and on legs entering or leaving EU ports must now be fully covered by purchased carbon allowances. More critically, methane and nitrous oxide were included in the regulatory scope for the first time, impacting LNG-fueled vessels particularly hard.
The transmission path of carbon costs is clearly visible. According to Ship & Bunker estimates, the EU ETS compliance cost per tonne of VLSFO fuel on intra-EU voyages in 2026 is approximately $314.46, nearly double the $173.15 in 2025. Combined with the FuelEU Maritime penalty mechanism, the comprehensive fuel and compliance cost per tonne of VLSFO on intra-EU voyages reached $829.94, up 5.9% year-on-year. Major carriers such as Hapag-Lloyd have announced EU ETS surcharge increases of approximately 45%, and Maersk has synchronously raised its emissions surcharge.
These costs are almost entirely passed through to shippers via surcharges. According to Professor Deng Jian of the School of Navigation at Wuhan University of Technology, shipping costs increased by an average of 3.7% after EU ETS implementation, with container shipping's ETS costs almost fully passed through, driving freight rates up by 1% to 5%. With 100% full coverage in 2026, this increase has expanded further. For export enterprises involved in EU routes, carbon surcharges have become an unavoidable fixed increment on freight rate quotations.
Following the dissolution of the 2M Alliance (Maersk + MSC) in early 2025, global container shipping entered a new landscape of "three pillars plus an independent giant": Gemini Cooperation (Maersk + Hapag-Lloyd, ~3.4 million TEU), Premier Alliance (ONE + HMM + Yang Ming, ~3.3 million TEU), Ocean Alliance (CMA CGM + COSCO + Evergreen + OOCL, ~3.8 million TEU, extended through 2032), and independently operated MSC (~6.4 million TEU).
The alliance restructuring is not merely on paper — it has directly altered capacity deployment patterns. According to MDST containership database comparisons, significant changes occurred between April 2025 and April 2026: on the Far East-Europe route, Gemini's capacity grew over 16%, raising its market share from 24% to nearly 27%, while MSC cut capacity by nearly 16%, dropping its share from 18% to 15%. On the Far East-North America route, Premier Alliance expanded capacity by over 22%, making it the fastest-growing alliance. The transatlantic route saw total capacity decline approximately 9% year-on-year, the only contracting corridor among the three major trade lanes.
Every alliance network adjustment brings accompanying voyage restructuring, port coverage changes, and schedule rearrangements. Freight forwarders and trade enterprises have found that once-familiar direct services may have become transshipment routes, and formerly weekly sailings may have become biweekly. Such structural adjustments were especially frequent in the first half of 2026, directly driving up the frequency of rate adjustments — when routes change, rate baselines must be recalibrated accordingly.
Unlike the past logic of "rates follow the market, rises and falls determined by the market," carriers in 2026 have demonstrated unprecedented capacity management discipline. Drewry data shows that multiple sailings on trans-Pacific routes were cancelled in late July, with carriers employing a combination of blank sailings, reduced frequencies, and space control to proactively tighten effective capacity supply, maintaining space utilization at near 100%.
Under this strategy, GRI is no longer a passive price adjustment merely reflecting cost increases, but has become a tool for carriers to actively manage freight rates. Before peak season, carriers concentrated GRI announcements, using the announced rate as a market anchor, then determining execution intensity based on actual booking demand. This also explains why freight rate indices sometimes decline while carrier GRI announcements remain dense — a GRI announcement is a target price, not a transaction price, but it sets the market's psychological expectation and negotiation baseline.
Additionally, the 2026 peak season arrived noticeably earlier. European and American retailers' inventory preparation window for Black Friday and Christmas shifted from the usual July-August to May-June, pulling demand forward and extending the upward rate cycle, naturally increasing GRI frequency.
On July 15, 2026, the Suez Canal Authority imposed a uniform 12% temporary surcharge on container ships. The Panama Canal, due to drought, reduced its draft limit to 49.5 feet (effective July 1), forcing Neopanamax vessels to lighten loads and losing hundreds of TEU per voyage. The two canals' "one hiking, one limiting" dynamic further raised the rigid cost floor of shipping.
Port-side congestion is also intensifying cost pressure. Northern European major ports saw yard density exceed 75%, with average vessel waiting times exceeding two days; New York port waiting times exceeded 20 days. Global liner schedule reliability hit a historic low of approximately 29% in early 2026, and although it recovered slightly in March, it remained at just 59.0%. Low schedule reliability means reduced vessel turnaround efficiency, further shrinking effective capacity, and carriers are forced to compensate for efficiency losses through surcharges and GRIs.
Conclusion: Frequent Adjustments May Become the New Normal
The frequent adjustment of shipping companies' freight rate rules in 2026 is not a short-term phenomenon driven by a single factor, but a structural outcome of four overlapping forces: the normalization of geopolitical conflicts, the hard landing of environmental compliance costs, the deep restructuring of alliance landscapes, and the discipline of capacity management. As long as Red Sea diversions persist, EU carbon costs continue to climb, and alliance networks continue to optimize, the frequent adjustment of freight rates will not stop.
For trade enterprises and freight forwarders, rather than complaining about "carriers raising prices every year," it is better to establish a dynamic rate management mechanism: closely monitor FMC-filed GRI announcements and SCFI/WCI index trends, rationally balance the ratio of long-term contracts to spot rates, lock in space and prices before GRI effective windows, and incorporate rate volatility as a routine variable in pricing models. In an era where uncertainty has become the norm, the core of supply chain resilience is not predicting freight rates, but building elasticity to respond to volatility.
Disclaimer: Data in this article is sourced from public channels for industry analysis reference only and does not constitute any decision-making advice. Actual freight rates are subject to carriers' official quotations.
联系人: Manager Li
电话: 021-31056166
邮件: sea-giant@sea-giant.com
地址: Room 1708, Pu Chuang Business Building, 1050 East Daming Road, Hongkou District, Shanghai, China