
Asia is the undisputed engine of global manufacturing and port throughput, but the vessels themselves are largely controlled by European shipping lines.
According to the latest data from Alphaliner as of July 2026, the global container fleet totals 7,592 vessels with a combined capacity of 34.428 million TEU. With just five carriers among the world's top 30, European companies control 55.3% of global container ship capacity – more than 18.9 million TEU.
Europe: five carriers, more than half the world
European shipping lines have long pursued a strategy of "big ships and big alliances", cementing their absolute dominance in the global shipping landscape.
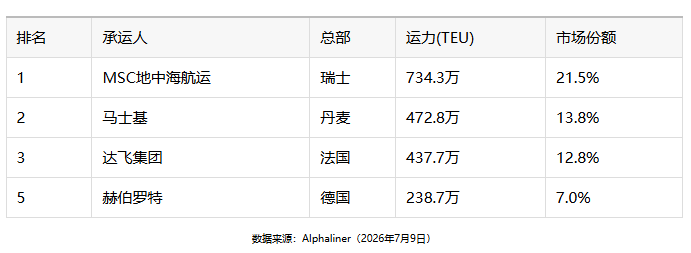
MSC leads the world with 7.343 million TEU, holding a 21.5% market share – the only liner company globally with capacity exceeding 7 million TEU. In May 2026, MSC's operational fleet surpassed 1,000 vessels, making it the first shipping company in history to reach the "thousand‑ship" milestone. Its capacity gap with second‑placed Maersk has widened to 2.615 million TEU.
Maersk operates 4.728 million TEU, representing 13.8% of the market, and remains a cornerstone of global trade. CMA CGM ranks third with 4.377 million TEU and is rapidly closing in on Maersk – its CEO has clearly stated that he expects to overtake Maersk to become the world's second‑largest liner company by the end of 2027. Hapag‑Lloyd ranks fifth with 2.387 million TEU.
Asia: the most carriers, a third of the market
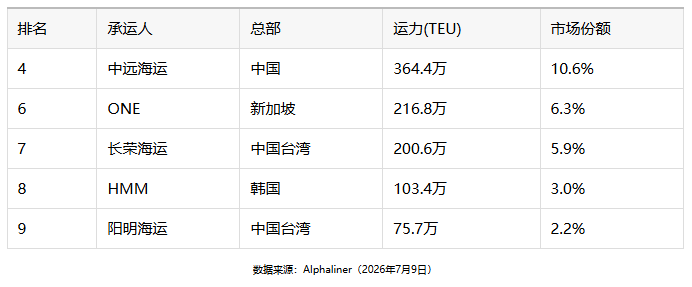
Asia is home to the largest number of carriers among the top 30 – 19 companies – which together control 35.1% of global capacity, exceeding 12 million TEU. COSCO Shipping Group ranks fourth globally with 3.644 million TEU, making it Asia's largest carrier. Ocean Network Express (ONE) operates 2.168 million TEU, ranking sixth. Evergreen Marine surpassed 2 million TEU in capacity during the first half of the year, becoming the seventh liner company worldwide to join the "Two‑Million‑TEU Club".
Middle East: 3.6% on the strategic waterways
Middle Eastern carriers collectively account for 3.6% of global market share, with capacity exceeding 1.2 million TEU. ZIM ranks tenth with approximately 694,000 TEU. Hapag‑Lloyd is currently advancing a US$4.2 billion acquisition of ZIM – if completed, it would reshape the capacity landscape in the Middle East and beyond.
Americas: 0.2% from the "Jones Act" players
The Americas account for only 0.2% of the top 30, represented by US‑based Matson, which focuses on domestic Jones Act trades and specific routes such as Hawaii and Alaska.
A few observations for reference:
The pricing power of European carriers is steadily strengthening. Five European operators controlling more than half of global capacity means that rate negotiation leverage is highly concentrated. Freight forwarders are not facing "dispersed competitors" in rate battles, but rather "coordinated oligopolists".
It is only a matter of time before CMA CGM overtakes Maersk. In the first half of the year, CMA CGM grew its capacity by 237,000 TEU (+5.7%), the fastest growth among the top ten. With 158 vessels on order, CMA CGM will further squeeze Maersk's market space over the next 18 months. The internal order among Europe's top three is being rewritten.
Asian carriers retain their regional advantages. Asian operators such as COSCO, ONE, and Evergreen are rooted in the world's most active manufacturing heartlands, giving them natural network density on transpacific and intra‑Asia routes. European companies control the "ships", while Asian companies control the "cargo" – the contest between the two continues.
Geopolitical risks in the Middle East are reshaping capacity deployment. Ongoing tensions in the Red Sea, the Bab el‑Mandeb Strait, and the Strait of Hormuz are forcing global carriers to reassess capacity allocations on Middle Eastern routes. The capacity loss caused by rerouting via the Cape of Good Hope is offsetting some of the capacity growth from new deliveries – which is one reason freight rates have remained elevated.
Goods are loaded into containers in the East, but control over the container ships lies in European hands. This capacity map will determine the pricing power in the global shipping market for the next three to five years.
Contact: Manager Li
Phone: 021-31056166
Email: sea-giant@sea-giant.com
Add: Room 1708, Pu Chuang Business Building, 1050 East Daming Road, Hongkou District, Shanghai, China
We chat